Showing posts with label statistics. Show all posts

Wednesday, December 09, 2009

The big three compared

OK – final note on stats, I promise. So, I have looked at data relating to the test match performance of Australia, India and South Africa.

First off, I have made an index of the three teams performances over the past five years, with 1 January 2005 being 100.
Still Australia beat the pants off the other two still, holding a commanding +10 margin over India and South Africa.

But, as Fred the commenter mentioned yesterday, perhaps this overstates their performances for the last two years. So, here’s the same graph, with the index starting on 1 January 2008.

In this graph, Australia have made next to no progress in the last two years. Whereas the other two, especially South Africa, have increased their score.

Interestingly, since May 2009 South Africa have been in relative decline, whereas India have been unmoved since then, saved for a slight increase in the past few months. By my calculations, this means that they are about tied with South Africa, by the ICC’s reckoning, India are the undisputed champions of the world!!11!!1!!

What this means for online sports betting is anyone's guess.

Tuesday, December 08, 2009

Australia depressingly god-like

Continuing my orgy of spreadsheeting debauchery, I decided to map out Australia’s decade in graphical form. And here we go.
And didn’t they do well. It is clear that the mighty Australians piss on all of us from a great height. England’s naughties peak of +18, and India’s current (world-topping) +13 is eclipsed into the toilet by Australia’s current score of +59. Australia peaked on 6 March 2009, with their win at Durban, with a total of 60.

Australia’s performance over the decade is marked by continual progress. Not the one step forward one step back pattern of England: Australia stride continually forward.

Interestingly, however, their “decline” is apparent in a recent plateau. Since the end of 2006, they have only increased their score by 10. Whereas, India’s last ten points took nearly four years, they were on +3 in March 2005.

In January 2008, however, Australia were on +58. And since that acrimonious home series against India, their scores has stabilised. Indeed, their total has increased by +1 in this two year period. It dropped to +57 in December 2008 in South Africa.

It appears that they were not the force that they once were. But hats off to them on a top decade: 117 matches and 77 won.

Better than Twickenham.

Sunday, December 06, 2009

Some statistics happen, and India become best in the world

It’s official. Again. Some team other than Australia is the best in the world, accordingly to faceless statisticians hidden in the neglected bunkers of Dubai’s crumbling skyscrapers.

That team is India. They have long held a team capable of destroy all before them, but it has taken them much bedding down and reorganising before they have done so. Although, more or less the same group of bland, school clerkish type men have dominated the side for the last decade, they have only “come good” after Australia have refrained from winning quite so regularly.

So, seeing as I had a touch of spreadsheetitus recently, I thought, how does India’s decade look? Worthy of “best in the world” status?

Here is a graph of some stuff:

Same rules as last time: +1 point for winning, -1 for losing and no points for drawing.

India are currently scoring their highest in the decade, with them presently on +13. Not quite as high as England +19 when the ICC had them as the second best team in the world, but pretty good, nevertheless.

So, what does this say? Exel is good? ICC is bad?

Their recovery from the bogged-down under-achieving period of the early decade seems sustained. But this improvement, although steady since 2005, is not dramatic.

Probably not worthy of Number One status. But, the only problem is that all the Number Twos are shit.

Tuesday, December 01, 2009

The “Let’s Not Go Too Mad” Theory of English results

I have always suspected that there is an intrinsic karma in English cricket. In test series where they are seemingly swept away, they come from nowhere to produce an ODI win. Similarly, any test series victories are punished by one-dayer drubbings.

There has been recent discussion regarding England apparent (ahem) edge over the South Africans in ODIs, but this trend only developed after the Saffer dispatched the Englanders at home in a test series.

It’s almost as if other boards have a reciprocal arrangement with the ECB, to make sure that the aggregate total of woe and misery in the British Isles never deepens below a specified nadir.

Consider the 2006-07 Ashes series (for those that acknowledge its existence). England were battered in the tests; yet triumphed in the one dayers. In fact, this appears to be a dynamic well-maintained in most Ashes campaigns.

So, I totted up all England’s results and put them into a spreadsheet, covering a period from 2000 until 29 November 2009. For this period, I have calculated their cumulative score. Each victory is given a +1, each draw/tie/abandoned match a 0 and 1 is subtracted when England lose. Here are the results:

Interestingly, the new decade starts brightly, with England soaring to a score of +6, but these heights are rapidly surrendered as they fall to -6 within six months. After a spell of soul-searching, Michael Vaughan’s captaincy finds a winning formula, and the 2004-05 period sees England’s total shoot to +19.

However, this high-water mark slips quickly below the surface, as their scores slides into negative figures.

Thereafter, they manage only to keep their heads above the water, with the score just into the positive. As of today, their score is exactly 0.

What does this signify? That England are unable to ruthlessly exploit advantage? That they are unable to push on? Are we most comfortable at give-and-take mediocrity?

Certainly, starting the decade at zero, and still sitting on a duck as the naughties come to a close is an unlikely statistic. Even given the bounties offered by Bangladesh, the West Indies and Zimbabwe.

This period encapsulates entire careers, and witnesses a number of cricketing generations. Yet, none seem able to permanently impose the success that their talent implies.

Will the English never relinquish themselves from their own averaging tendencies? Are we happiest sitting at a statistical mean?

Maybe we are just rubbish in the mind?

Thursday, April 30, 2009

Cut-off dates in cricket

I’ve recently finished Malcolm Gladwell’s interesting Outliers book, which rambles on about successful people. The reasons for certain individuals doing great things is due to factors outside their own control, such as their family, timing and opportunities. Excellence comes from chance events and environmental conditions.

Gladwell outlined one study which identified that in the highest level of Canadian ice-hockey an over-whelming number of players were born in January, February and March – well over fifty percent of some terms were born early in the year.

The reason? The cut-off date for youth levels was the 1st January, giving a year’s advantage to beef up and enhance their hand-eye co-ordination to those born earlier in the year. Once this advantage had been bedded in the early years, it reverberated into the professional leagues.

So! I wondered, what about the England cricket time? Any effect there? Here’s a chart of the birth months of the recently announced test team against the West Indies, and those still with lingering contracts.

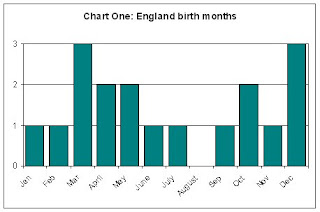
It doesn’t show us much, really, does it? Other than anyone being born in August is completely knackered already. Although this crumb in itself backs Gladwell’s thesis, as the cut-off date in the English junior leagues is 1st September.

Perhaps the longevity of the games levels out early differences, or the confinement of cricket to a relatively short season negates age advantages?

Generally, though, it seems as though the English selection policy at schools and villages seems to be working ok. No one is unfairly favoured by the system. Grand.


Now, lets look at the Australian cricket team:


The cut-off for Cricket Australia is also on the 1st September, but there seems to be a noticeable effect here. Indeed, more than a fifth of the entire squad were born in the month of October, with a half being born in the last quarter of the year.

So, clearly, Australia discriminates, whereas England doesn’t. According to Gladwell we would therefore expect “double” the amount of elite level cricketers in England, compared to Australia. The Pommies should crush the pommies at every meeting.

Oh dear.

Maybe discrimination at the youth level is a good idea itself, no matter which criteria you deploy to distinguish between candidates, as this allows you to focus energies on enhancing the abilities of someone who is at least reasonably good. Whereas the “let’s all have a jolly good time” approach of English cricket may not be set up to pick out and invest into those displaying talent.

That these two data sets display very different patterns, despite sharing the same cut-off date, suggests that there is something else going on here. Or maybe nothing at all. In any case, the data speaks for itself, and I need add nothing more.

Wednesday, October 29, 2008

England beaten by huge margin at the hands of stars

According to AYALAC’s refined methodology of re-weighting a team’s score by using irrelevant criteria, England lost to the star-peppered Trinidad and Tobago yesterday.

And by buggery did they lose big.

D. Charlton asked a cutting question recently (it was, I admit, hard to find sense in a fog of misguided comments). He asked:

“How many runs to England need to score to beat T&T tonight - before a ball is bowled?”

Well, let’s see. T&T’s land area is 1,980 square miles, and, as we saw yesterday, England is 50,351 square miles.

So, by my reckoning, the first ball of the match needed to be a no-ball, from which, England would proceed to run a relative modest 3,335 over-throws.

After achieving this, only then could England consider winning.

But, once again, our boys in whatever colour it is their advertisers have chosen for them these days, have failed us. And failed us bad.

By my recalibrated understanding of “the rules” England lost by 3,499 runs. Once again, not only did the opposition manage to chase down England’s total of 141 after just two balls, but they proceeded to put on a sensational show of hitting just to entertain the crowd and certain deluded parts of my mind.

What a victory by the young men from two islands whose names both begin with the letter “T” – what are the chances of that! After such a strurpling win under their belts, success, wealth and many, many women will surely come their way.

For England (and a small, rubbishy part of South Africa) this day will live in infamy. INFAMY.

Monday, October 27, 2008

Bit of England beaten by the rest of England

The Allen Twatford league has started recently.

The “All-stars” (containing, by my count, exactly two stars) beat Trinidad and Tobago (who have three stars).

Middlesex, spurred on by its greatest member, Twickenham, only just lost to the bullying efforts of all the rest of England combined. You might say that it was unfair. So, being the failed statistician that I am, I would like to correct the imbalance using mathematics.

Middlesex is 282 square miles and its population totals 1,576,636, of whom 738,904 are males.

England, on the other hand, is 50,351 square miles, with a population of 49,138,831 (let’s say 49% of them are male: 24,078,027).

England is 179 times bigger than Middlesex, and 32 times more populace (in terms of males).

So, using high level statistical theory that none of you would understand, we can adjust for this difference, to reveal the actual result:

England (122) lost to Middlesex (19,511) by 19,389 runs.

Not only did the London side surpass the England score with ease, but that added nearly twenty thousand more runs just for good measure.

This, I think we’ll all agree, is a much more accurate way of measuring the relative disparities in sides, and should be rolled out to all real statisticians forthwith.

Monday, November 12, 2007

Cricket averages: a rebuttal

Andrew Mosey has written a response into my own analysis into the validity of cricketing statistics. In an overview of Michael Atherton’s test career, I argued that his average of just under 40 didn’t adequately reflect his likely performance on the day.

I rather regretted this conclusion, as Athers was one of my all time favourites, and mused on the possibly devastating effects this method would have on an Australian invincible of old. Indeed, Andrew rose to the challenge and analysed the test career of Don Bradman.

Annoyingly, Sir Don didn’t look as useless as I hoped. His median score was 167. This is, unfortunately, still pretty good. Most interestingly, the standard deviation is 87, which we could argue seriously damages the validity of his research. Especially when we compare it to the former England captain’s standard deviation of 37.

However, there is a more mature criticism we can offer. When looking at Athers’ glorious years I was surprised at his success to failure ratio. Indeed, I found that three quarter’s of his innings resulted in what we would term “a failure”.

Similarly, Andrew found:

“Looking at the number of 50+ scores achieved by the Don, you'll find this occurred in 42 of his 80 innings; an incredible 52.5% of times he walked out to bat he was soon raising it to the crowd.”

OK – this record is better than our Michael's. Obviously, Atherton was a superior to Bradman in many ways, and these petty statistics only detract from that fact.

However, what they do show up is the astonishingly high number of batting failures. If, say, I cocked up five times out of ten at work (you know, I spilled the tea whilst on my way to brown-nose my boss) my office test career would be of Zimbabwean proportions. And yet, this half-present batsman is considered the greatest player of all time.

If Pete Sampras lost half his matches we would assume he was English. If every other Shakespearean play was shit we would assume the Bard was American.

Yet these are the appalling standards that international cricketers expect us to accept. Why are their standards so shoddy? Why do we tolerate these failures without question?

Frankly, I have had enough of it. No more excuses you lot. Pull your socks up.

Tuesday, May 08, 2007

Cricket averages

Statistics is an important part of cricket. Heck, it is an important part of life!

The most common statistic in cricket is the average, or, to be more precise the arithmetic mean. Averages apply for both bowlers and batsman, but it is more of a concern to batsman who are not as numptied in the head as bowlers. “My average” is the most important number in a batsman's small world; he is obsessed by it. You can tell how well someone is doing this season by how they talk about averages in general. If they emphasise the usefulness of averages, they scoring well, whereas if they’re having a stinker they seem indifferent and even aloof to blind statistical practices.

Being rubbish, I have always had doubts over statistics, especially since there is so many ways of calculating measurements of central tendency. Let’s put stats to the test.

Below is a histogram of Michael Atherton’s test career – one of my favourite cricketers.

First off, I’m afraid the complex mathematics involved in sorting out the not outs is far beyond me, so I shall assume all innings are complete. This gives us an arithmetic mean of 36 (which is not far off his true average of 37). The standard deviation is absolutely hopeless, given N, but I’m not sure that really applies to cricket.

However, you will notice that the normal distribution of the line graph has kurtosis, and is definitely slanted to the left. In such instances, working out the mean doesn’t always give an accurate middle value, and gives undue influence to large outliers.

So! What are the alternatives? Well, there are a number of incredibly complicated methods of working out means (generalised mean, harmonic mean, etc.) but I don’t begin to understand them. I can work out, however, three other GCSE mathmatical measurements: the mode (the most frequent value), the mid-point (that value between the lowest and highest x) and the median (the middle value). They are:

Mode: 0
Median: 23
Mid-point: 92.5


The mode is clearly useless. Yes, Athers got a lot of ducks (20), but we didn’t expect him to score naught every time. The Mid-point is a very dodgy way of working about central tendency and should be ignored. (Although, it is nice to dwell on a possible world where my hero averaged over 90.)

The median shows an interesting phenomenon. Although Atherton was regarded as one of the best batsman of his generation, in more than half of his innings he failed to meaningfully contribute. If, like me, you have ranked all his scores on excel and divide them into quartiles, then you will see that it is only the upper quartile that has anything over fifty.

In essence, it is a quarter of Atherton’s total innings that does the work for his average. If he returned to test cricket again, we should expect three quarters of all his innings to be a failure. And yet his average is nearly forty, this doesn’t seem right.

In hindsight, I should have analysed an Ozzie’s career, and said how he was really over-rated and averaged seven, or something. Maybe at another Ashes whitewash.

There was going to be another graph saying something brilliant. But I’m simply too exhausted by all the stats. Sorry. Just know that I cast doubt on the general averages-in-cricket direction. But not Athers. He’s a god. No. The God.